- Primary Production: despite general dependence of secondary on primary production, sometimes poor measure/predictive of secondary production:
- Phytoplankton may be no good food for zooplankton
- Primary production is more than zooplankton can consume, large part of primary production sinks out of watercolumn: sedimentation
- Part of primary production enters microbial loop with less transfer to higher trophic levels
- Asumption: Production = D biomass / D time
- Problem: hard to follow distinct population or cohort (individuals of same generation/ age) and/or same body of water over extended times
-
Cohort
analysis: Knowing succession time of developmental
stages (cohorts), number of individuals per cohort and average body mass
can provide secondary production
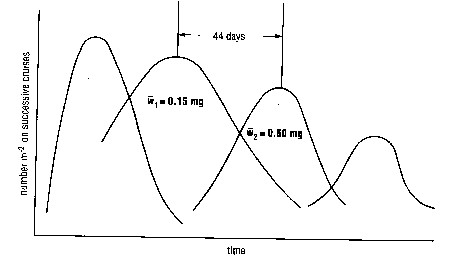
- Changes with life stage, season, food supply; may be negative in winter when zooplankton dont feed and lose weight
1. Laboratory-scale experiments
- study individual organisms in small volumes of water; typically food requirements/prefereces, transfer efficiencies, physiological responses upon stressors (temperature, salinity, UV, etc.); depend on easy to handle species, mostly herbivorous copepods
- Grazing rates: selected food organisms are added in known numbers, disappea rence of food is quantified; Food uptake is mostly linear above a minimum threshold food concentration and below food saturation
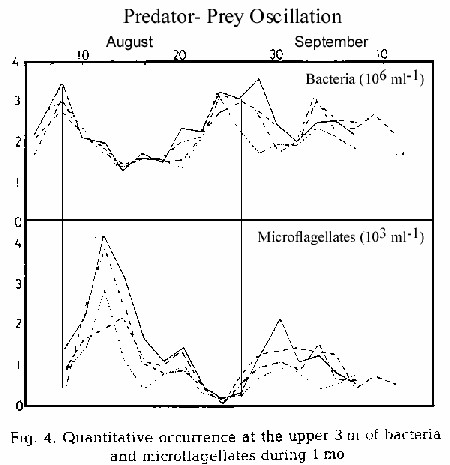
- Predator-Prey Oscillations: Predators will grow after their food source has grown to provide enough food for rapid reproduction; predators will decrease food abundance until they become food limited; grazing pressure decreases, thereby food can proliferate again, etc.
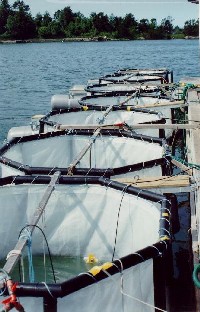
- also referred to as mesocosm experiments large containers of seawater or plastic bag-encolosed seawater in situ to study interaction of trophic levels and their responses upon environmental changes
- Mesocosm > 1000 L; microcosm 10 1000 L
- Problems: lack of natural turbulence, growth on wall of containers, careful choice of vessel material as to toxicity and chemical absorption
- Benthic species can be included by open-bottom systems mounted to the sea floor; still dwellers and in-bottom fauna may move in and out through the sediment (sediment enclsoures by deep collars)
- Benefits: studies of pollution effects in large water bodies without impact on the environment; time-series in the order of zooplankton generation times within the same water body
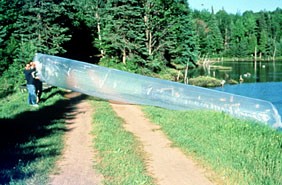
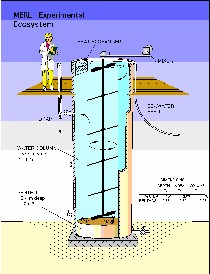
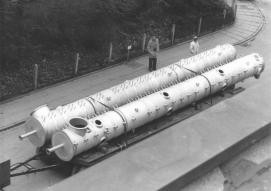
More information on the "plankton tower " (lower picture, upon delivery) used by the Max-Planck-Institute for Limnology in Plön, Germany, klick here!
- Concept: Known data and measured variables are fed into mathematic models to describe (static models) or predict (dynamic models) not measured or not measurable natural processes
- Types of models: contain variable numbers of compartments
- Parameters:
- Forcing functions: irradiance, nutrient concentrations, contrains on proudction
- Physiological functions: non-linear reaction of organisms to forcing functions
- Phasing functions: modify (speed up or slow down) physiological functions, e.g. temperature dependence of physiological reactions
- Advantages: Models can describe or predict what we cannot yet measure due to technical difficulties; especially predictive models can describe the potential outcome of what if scenarios and are helpful in management and mitigation projects
- Problems: Models rely on numerous assumptions and generalizations; number of compartments is always less than natural complexity of ecosystems; models cannot subsitute for real life measurements; models have to be verfied for each new ecosystem/region applied to by ground truth data
- P/B ratio: Production / Biomass, mostly on annual scale, but shorter time scales are possible; i.e. P/B = 300 of phytoplankton means that phytoplankton produces annually 300 times its own biomass; land plants are high biomass but slow growth organisms, thus their P/B is only 0.2-0.5!
- Decrease with size and body mass within and among different species
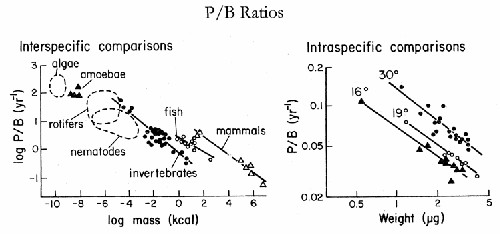
- Decrease with each trophic level by one order of magnitude (remember transfer efficiency among trophic levels ca. 10% only!)